
The Able Score: One Number for the Whole Picture
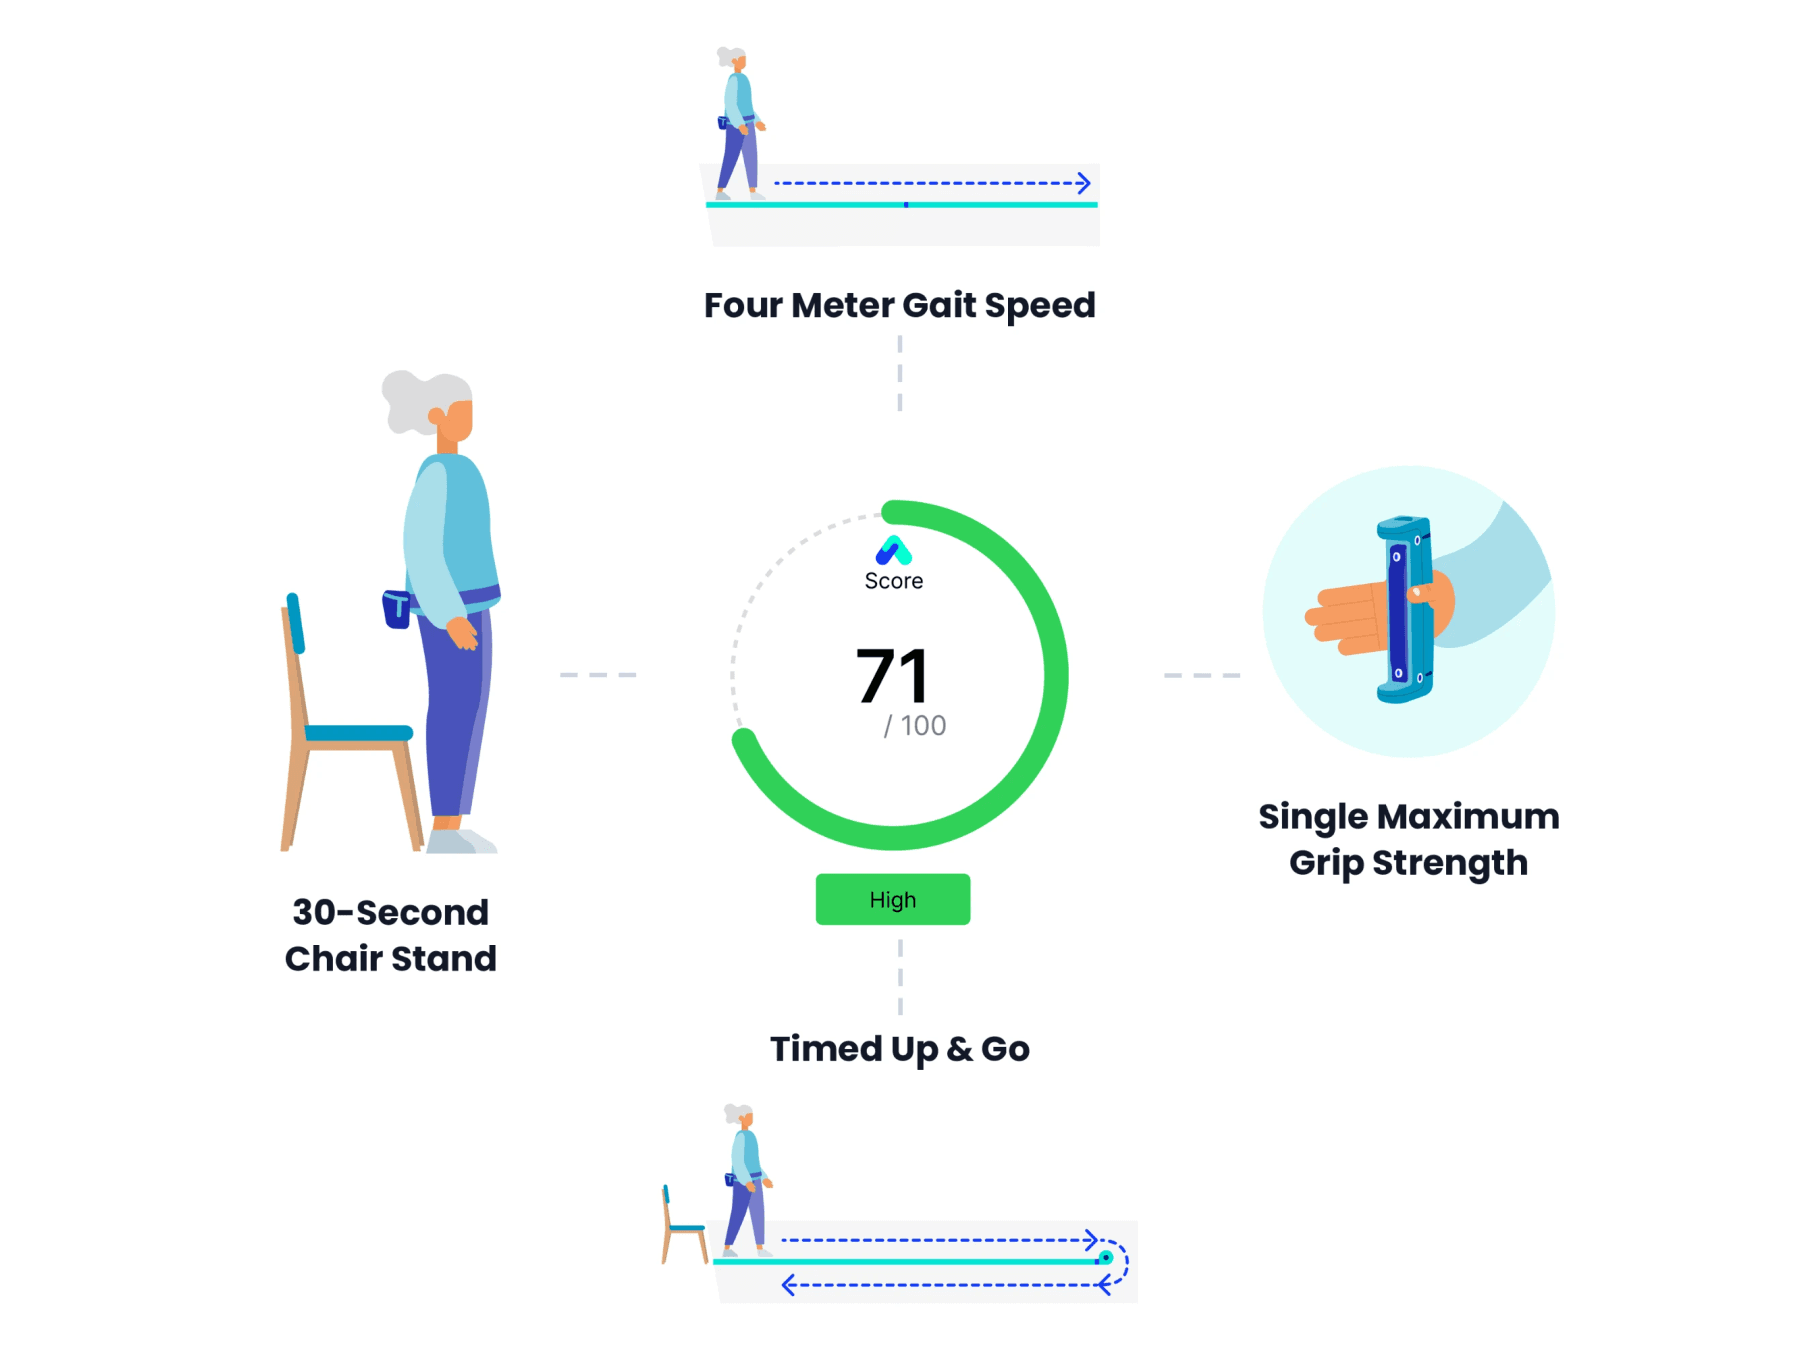
Every Able Assess screening already produces four solid results, but four numbers on four different scales don't answer the question caregivers actually ask: so, overall, how is this person doing? The Able Score does.
PDF Resource
Able Score Technical Overview
Save or share this guide
The Able Score: One Number for the Whole Picture
Able Assess empowers anybody to screen a senior for their risk of falling in five minutes or less. Now, Able Care is introducing a new feature: the Able Score, giving users a more streamlined way to conceptualize risk and track it over time.
What It Is
Every Able Assess screening already produces four solid results: grip strength in kilograms or pounds, chair stands in reps, timed-up-and-go in seconds, gait speed in meters per second. Each is meaningful, but taken together they don't add up to an easy answer to "so, overall, how is this person doing?"
That's the gap the Able Score closes. It takes every result from a screening — grip strength, 30-second chair stand, timed-up-and-go, and 4-meter gait speed — and folds them into a single number from 0 to 100. Higher is better. One score, one glance, instead of four numbers you have to mentally juggle.
It's also comparable across ages and sexes. Because each test is scored against normative data for that person's age and sex before it's combined, a 78-year-old woman and a 62-year-old man with the same Able Score are performing equally well relative to their own peers — even though their raw numbers look nothing alike.
Why It Matters
It turns scattered data into a real read on functional health and falls risk. Instead of eyeballing four separate results, caregivers get one consolidated number that reflects how someone is actually doing, physically, right now.
It makes change visible. Because the score is calculated the same way at every screening, tracking it over time shows whether someone is holding steady, improving, or sliding — turning a single snapshot into a trend line.
It makes hard conversations easier. "Your mom's grip strength is in the 9th percentile but her gait speed is in the 13th" is a mouthful. "Her Able Score is 8.5, in our Low Band" is not. That clarity helps caregivers communicate plainly with the seniors they support and with families who want a straight answer.
How it's Calculated
Each test result is converted into a percentile using published normative data matched to the person's age and sex. Those percentiles are averaged and placed on the 0–100 scale automatically as soon as the screening wraps. Any test that's skipped, or that has no normative data for that person, is simply left out of the average rather than dragging the score down. More information regarding the normative data utilized can be found here.
Scores land in three bands — Low, Medium, or High — based on where they fall against previous screenings (the bands get refreshed as more data comes in).
How It Relates to the Falls Risk Flag
The falls risk flag is a separate, binary check: it fires when someone 65 or older crosses an established clinical threshold on timed-up-and-go, gait speed, or chair stand. The Able Score is a continuous measure that sits alongside it, not a replacement for it. The two tend to move together — lower scores correlate with a higher chance of being flagged — but they can diverge in telling ways. Someone flagged on a single test can still score higher overall than someone who isn't flagged at all, because the flag reacts to one threshold while the score reflects performance across everything measured.
That's the point: the flag tells you if there's an immediate concern, and the score tells you the fuller story of how someone is functioning — and where they're headed.
Where You'll See It
The Able Score is calculated and saved with every screening. It can already be shown at the end of a screening, and it's coming soon to the Able Care web portal and PDF reports, along with third-party integrations. Because it's already normalized for age and sex, it also works at the population level — letting a facility track its own group over time or benchmark against others, regardless of how their populations differ.
The Able Score reflects functional performance relative to normative data. It is not a diagnostic tool, does not predict falls on its own, and doesn't replace clinical judgment or the risk flag alongside it.